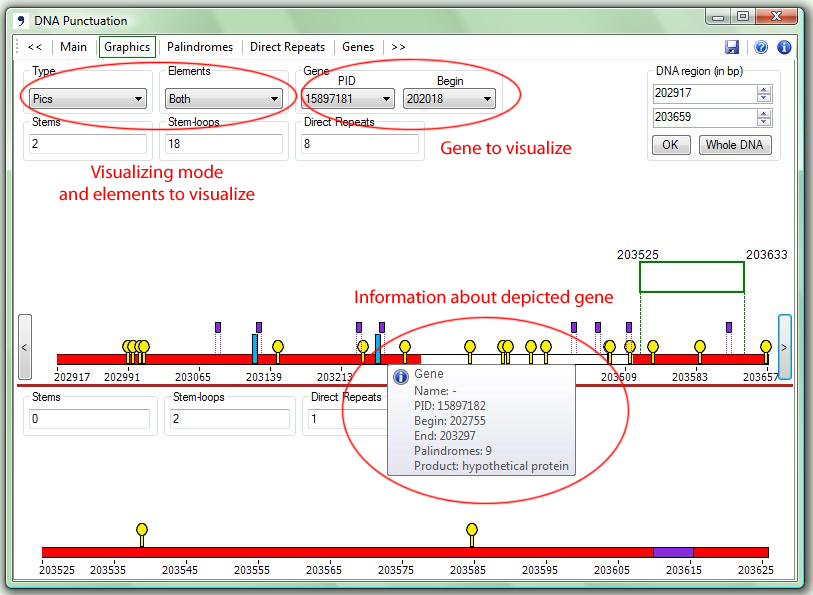
The Graphics Panel consists of two graphical images: Upper Graph and Lower Graph.
Upper Graph
 With
the Type
drop-down menu the user can choose the way of a palindrome/repeat
visualization.
Three visualization types are available: histograms, noise and pics.
With
the Type
drop-down menu the user can choose the way of a palindrome/repeat
visualization.
Three visualization types are available: histograms, noise and pics.
 The Elements
drop-down menu allows the user to choose the type of the structures: palindromes, direct repeats
or both.
The Elements
drop-down menu allows the user to choose the type of the structures: palindromes, direct repeats
or both.
 The Gene
pane allows the user to browse by the gene PID (Protein Identification
Number) or by the gene location.
The Gene
pane allows the user to browse by the gene PID (Protein Identification
Number) or by the gene location.
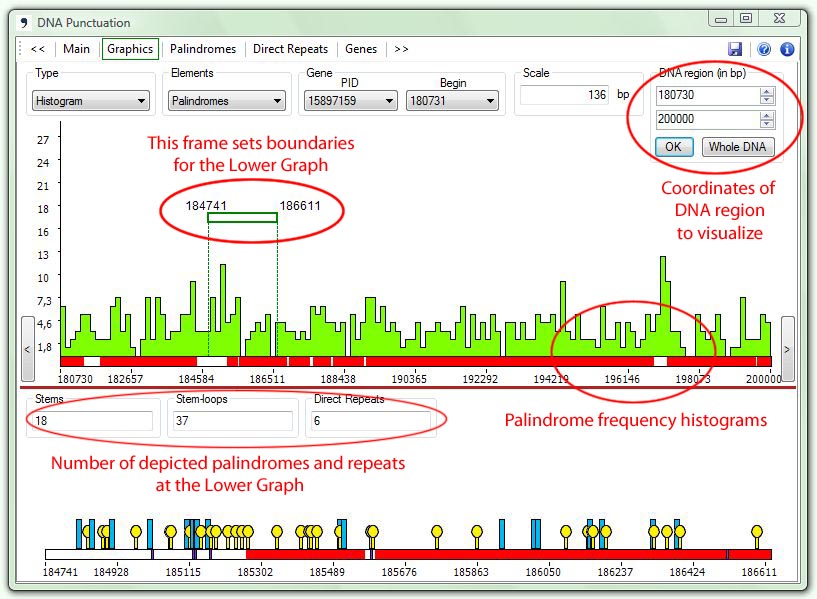
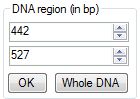 At
the DNA
Region
pane the user can set up the DNA region boundaries in nucleotide
positions.
At
the DNA
Region
pane the user can set up the DNA region boundaries in nucleotide
positions.
At the appeared graph, the line symbolizes DNA sequence. Red color
corresponds to genes and white color corresponds to intergenic areas.
Upon moving
the cursor over genes in the Upper
Graph, a pop-up window will present data on the genes based on
the .ptt file.
| 1. | With the type Histogram the program depicts histograms of palindrome/repeat density within the specified part of the sequence: |
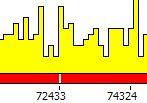
 The
pane Scale
shows the number of symbols (in bp) for one histogram bar.
The
pane Scale
shows the number of symbols (in bp) for one histogram bar.
| 2. | With the type Noise the program depicts palindrome/repeat frequencies within the specified part of the sequence: |

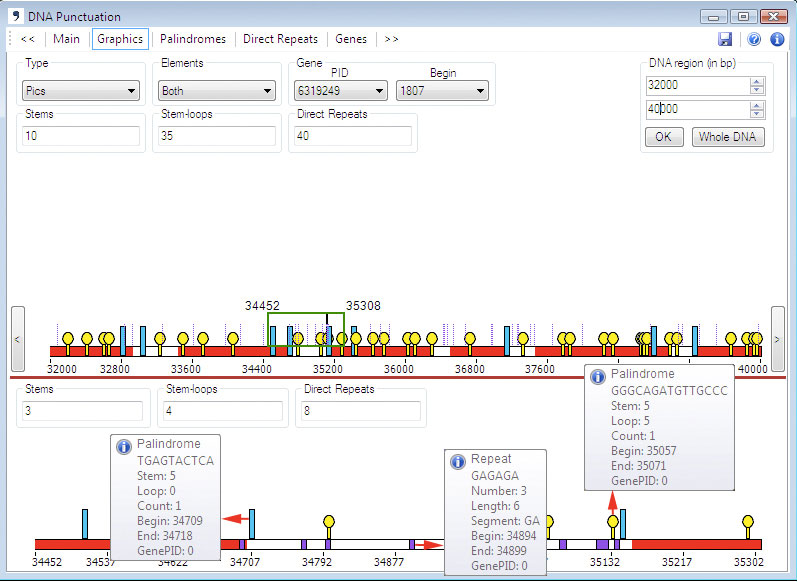
| 3. | With the type Pics the program depicts every palindrome/repeat by a stand-alone icon. The exact palindromes (stems only) are depicted as blue bars, stem-and-loop structures are depicted as yellow pins, direct repeats are depicted as violet rectangles with width proportional to the repeat length. |
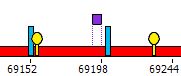 .
.
Panes Stems, Loops and Repeats shows the number of repeats and palindromes of each type.
![]()
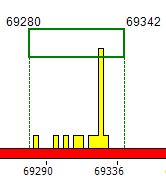
Lower Graph
To
obtain detailed information about the detected structures the user can
select a region (left button down and drag) from the Upper Graph, which will then be
depicted in the Lower Graph in
an
enlarged scale.
Upon
moving the cursor over palindromes or direct repeats in the Lower Graph
a pop-up window will appear showing structure info in the following
order: the sequence, start and end positions, number of times this
sequence is found in the whole genome, gene PID if the sequence is
found inside a gene or zero if the sequence belongs to an intergenic
area.
\